Claude Code tells you very little about where your tokens go. A session ends, /stats shows a total, and the story behind that number is lost: which agent filled the context, which call missed the cache, whether a sub-agent was worth what it cost. After the session logs are parsed into PostgreSQL, the data to answer these questions exists. But rows in a table are hard to read.
That is why the Claude Code Session Analytics project leads to Grafana. Four dashboards turn the same data into pictures you can scan in seconds, and they are built as layers: you start from the big picture of your spending, zoom into one session, then step back out to see how sessions connect and what a whole piece of work really cost. Each dashboard answers the question the previous one raises.
1. Usage overview — where do my tokens go?
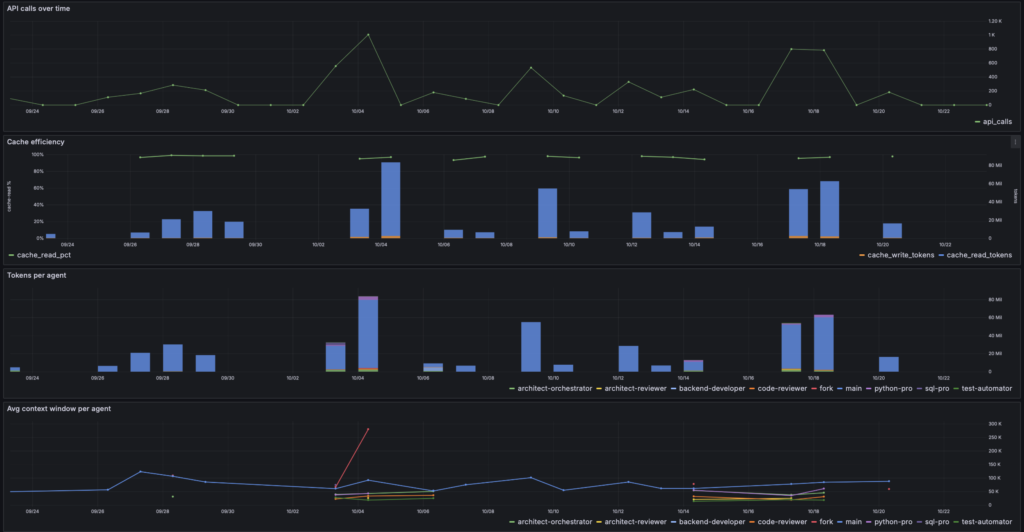
This is the dashboard to open first. The top row gives you the whole picture at a glance: total tokens, the same total with the /stats arithmetic (so you can compare it directly with what Claude Code reports, which double-counts output tokens), cache-write tokens, sessions, API calls, cache-read %, durations, two cost estimates and the average context window per call.
Below it, time series for tokens, API calls and cache efficiency show how your usage moves over days and weeks, so a sudden spike or a slow drop in cache efficiency stands out immediately. A session explorer table shows which sessions are worth a closer look, and two panels per agent type, tokens and average context window, show whether the cost comes from the main agent or from one of the sub-agents.
Two extra filters that were useful along the way:
Agentnarrows everything to the main agent or one sub-agent type.Small sessionshides, by default, sessions shorter than 30 seconds or with fewer than 5 calls, so a quick question does not distort the averages.
2. Session detail — what happened in this session?
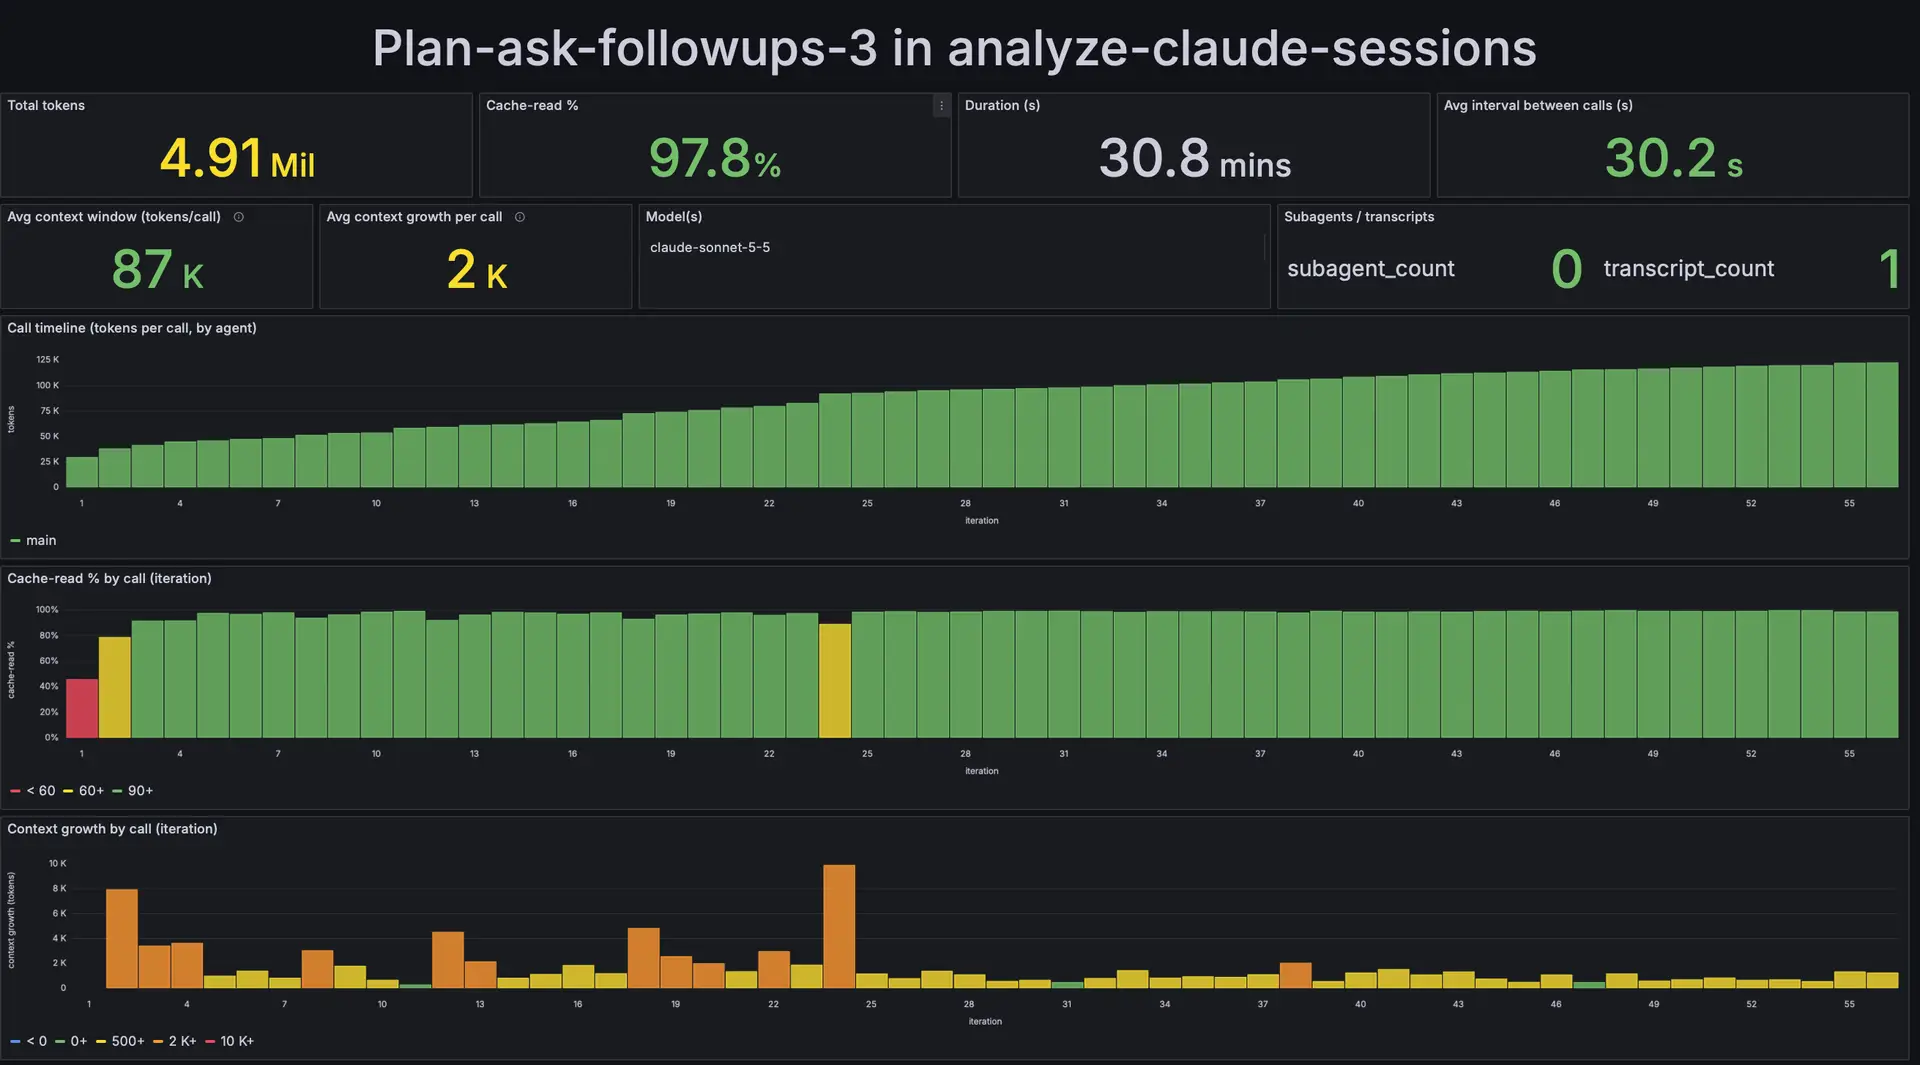
When the overview points at an expensive session, this dashboard tells you why. You select one session and replay it call by call: a timeline of tokens per call and agent, the cache-read % of every call, how the context grows from one call to the next, and the time between calls. Tables complete the picture with the long gaps (5 minutes or more), the agent and sub-agent breakdown, the model mix and every API call.
Its biggest advantage is that it makes cache misses visible. In a total, a miss disappears. Here it is one call where the cache-read % drops and the cache-write tokens jump, and the long-gaps table next to it lets you check whether a pause came just before it.
3. Session lineage — which session started which?
In my workflow, standalone sessions are not the norm.
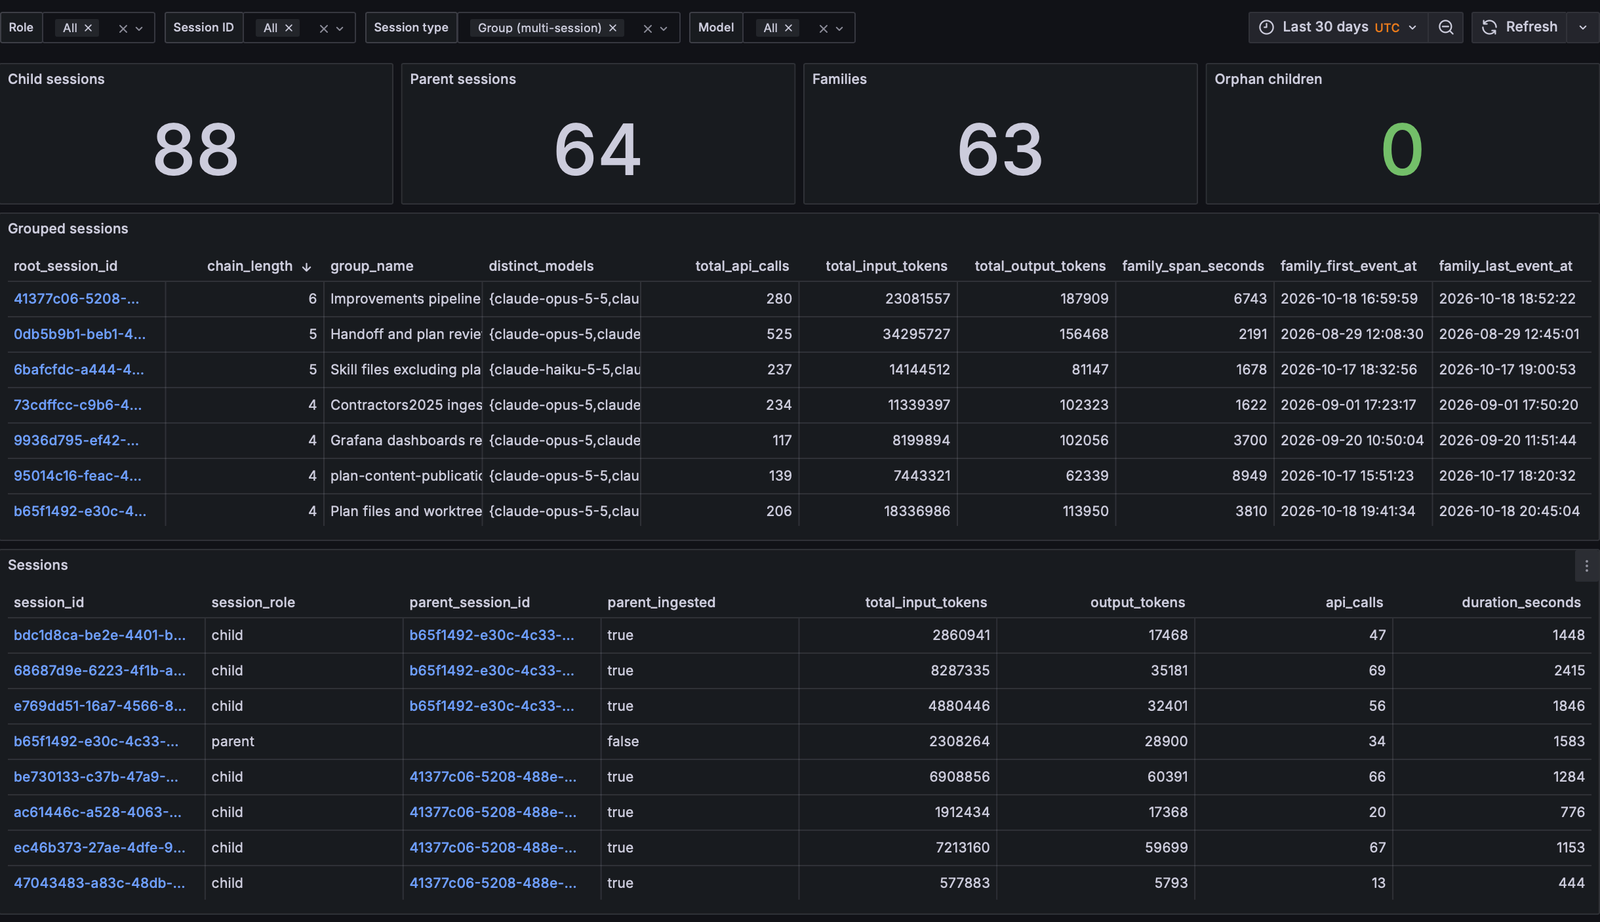
One session starts another, a sub-task gets its own session, and the work spreads out. The lineage dashboard puts that structure back together.
Stat panels count child sessions, parent sessions, families and orphan children (a child whose parent is not in the database), so you see at once how much of your work happens in chains. Two tables list the grouped sessions and every session with its role, root and depth, and a time series of tokens by role shows whether the tokens go to the sessions you start or to the ones they spawn.
You can filter by role, session type, model and, optionally, one session ID.
4. Multi-agent group sessions — one chain as one session
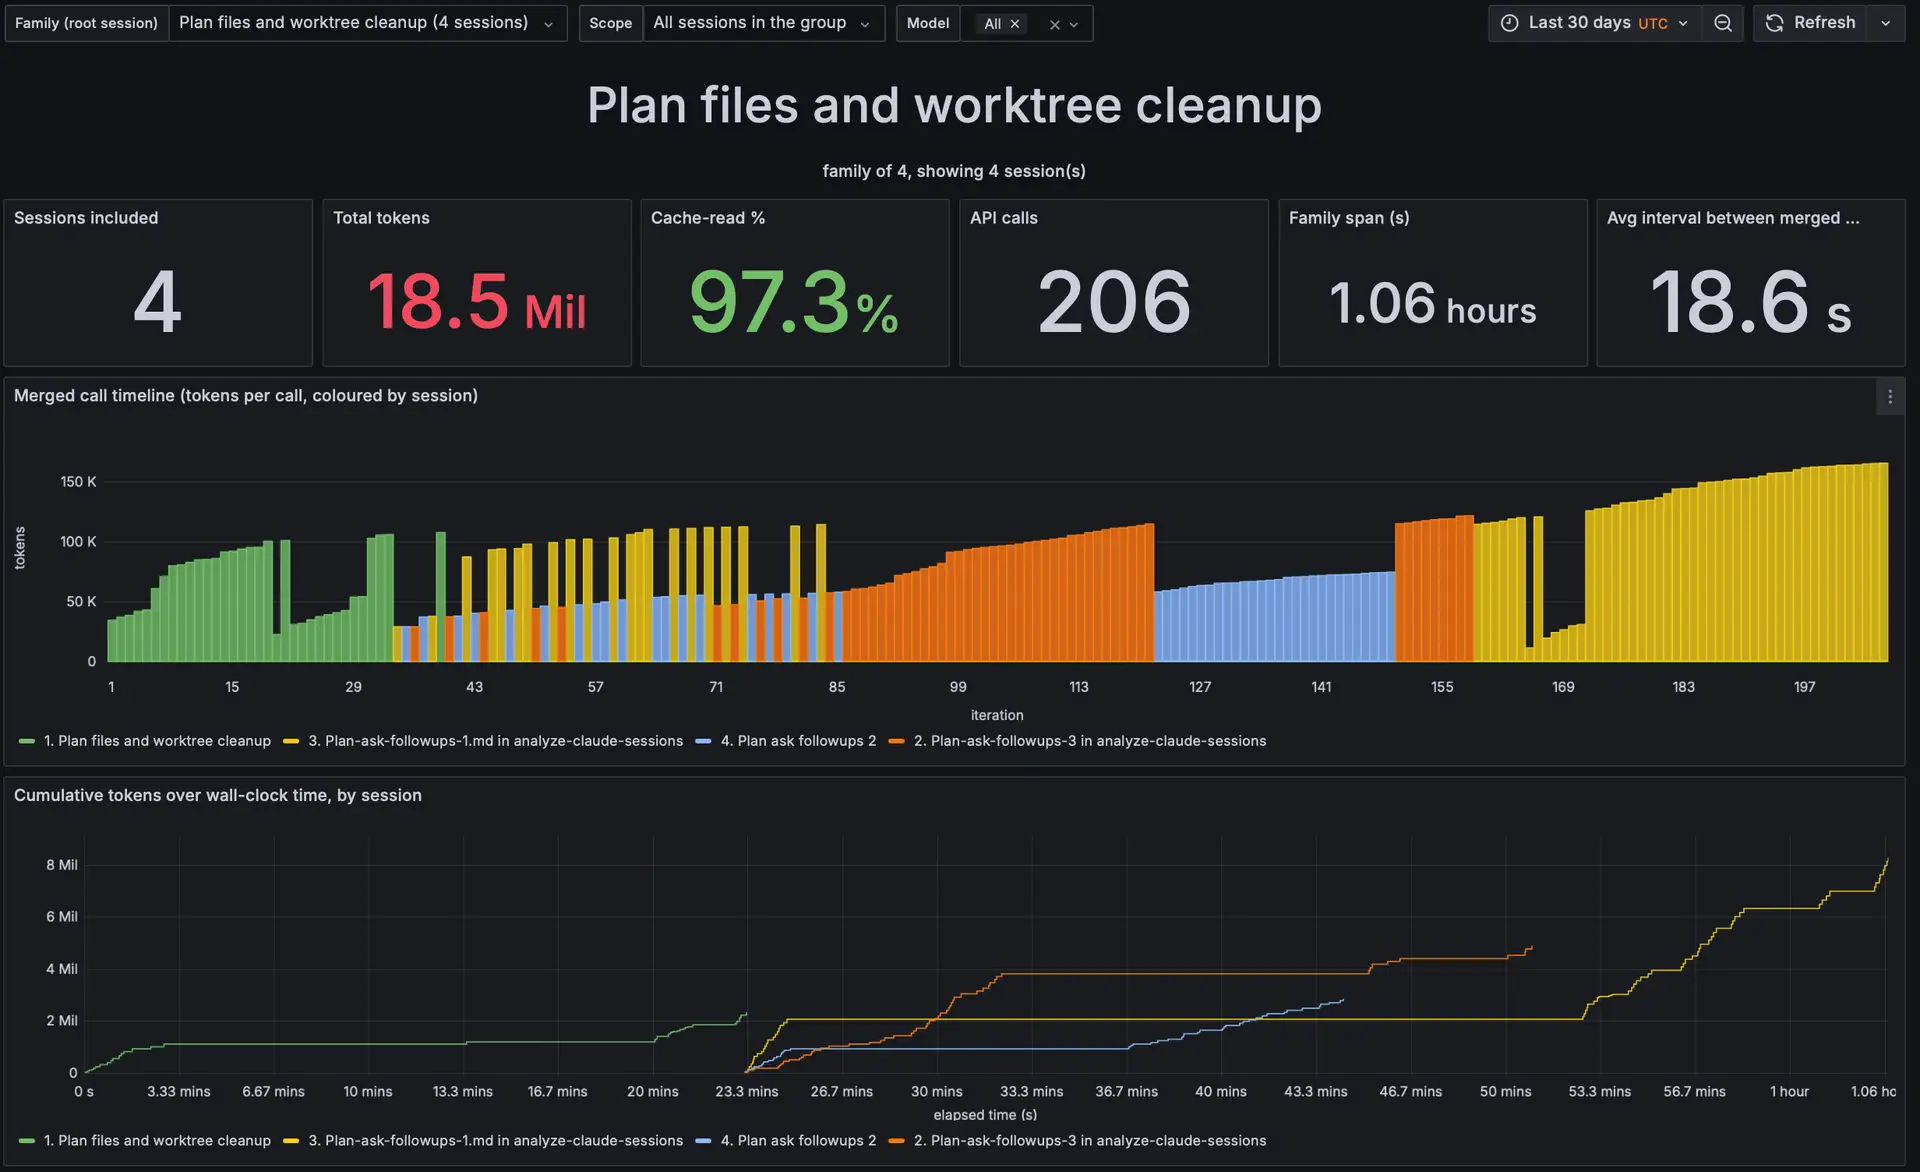
The last dashboard closes the loop. Once you know which sessions belong together, you want to see the chain as the single piece of work it really was. You select the root of a chain, and the dashboard merges all its sessions into one timeline: tokens per call coloured by session, cumulative tokens over wall-clock time, cache-read % and the time between merged calls.
Tables show the family members, the agent breakdown, the model mix and the tokens per session.
This answers the question no single session can: what did the full piece of work cost, across all the sessions it needed
Variables and filters
The four dashboards share one set of variables, so moving between them feels like zooming in and out, not switching tools.
modelis on all four, with all models combined by default.agentandsmall_sessionsbelong to the Usage overview.session_idis required on Session detail and optional on Session lineage, where an empty value means all sessions.role(parent, child, standalone) andsession_type(simple or group) filter Session lineage.- On Multi-agent group sessions,
root_session_idpicks the chain, listed by its title and length, andscopeswitches between all its sessions and only one member.
All dashboards show time in UTC.
Provisioning as code
None of this is clicked together by hand. Grafana loads everything from docker/grafana/ when it starts: the PostgreSQL datasource and the four dashboard JSON files. There is nothing to import. A change to a dashboard is a change to a file, reviewed in a pull request like any other code, so the dashboards are versioned, reproducible and always match the repository.
The datasource connects as grafana_reader, a role with SELECT rights only on the claude schema. Grafana can read the data, but never change it.
Running it
One command, make dashboard, starts PostgreSQL and Grafana at http://localhost:3000. The port is bound to 127.0.0.1, and Grafana runs with anonymous access and no login, which keeps it simple for single-user local use.
New data appears after the next make ingest.
Links
Project page: Claude Code Session Analytics.
Code: GitHub (dashboards in docker/grafana/dashboards/).