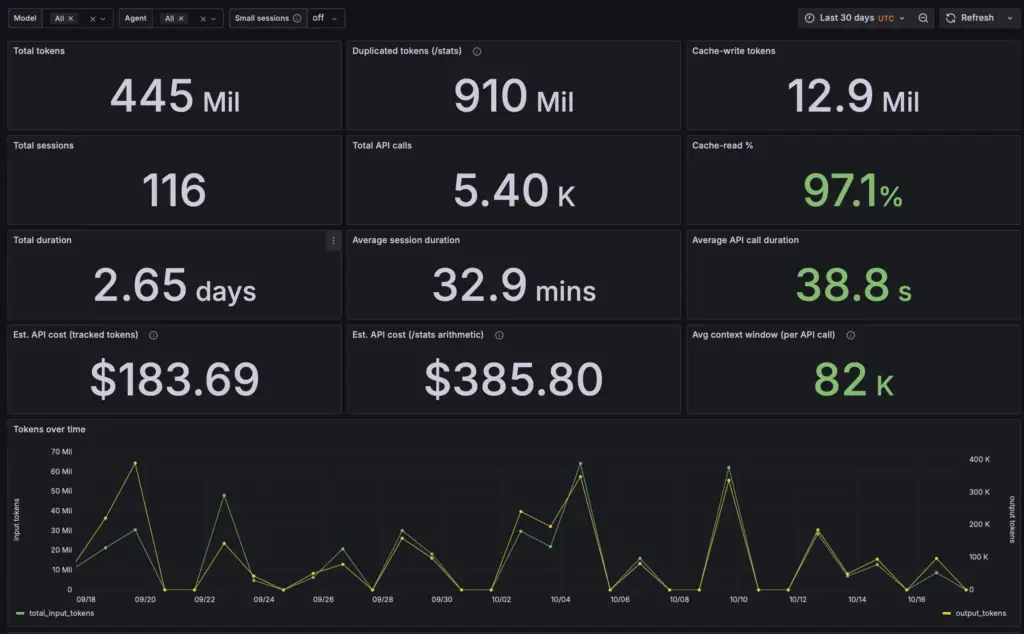
I have been using Claude Code almost every day for the past few months. From the beginning, I had a simple question: where do my tokens actually go?
Claude Code has /stats, but it gives one total. It does not tell me which session was expensive, how much the cache saved, or what my sub-agents used. The data is on my disk: each session writes a full transcript to ~/.claude/projects. So I built a tool to read it.
What the tool does
Claude Code Session Analytics reads the transcripts, loads one row per API call into PostgreSQL, and shows the data in four Grafana dashboards. It runs in Docker, on my machine. No data leaves the machine and it needs no API key.
- tokens per call: input, cache write, cache read, output,
- sub-agent calls in their own rows,
- an estimated cost at API list prices,
- the links between sessions that start other sessions.
The numbers
Three months of my own usage (2026-07-18 to 2026-10-17):
- 46 projects, 655 sessions, 1,174 transcripts, 25,678 API calls,
- 1.83 billion billed input tokens, but only 12.1 million output tokens,
- 96.74% of the input tokens were cache reads,
- sub-agents used 23.9% of the input tokens: 438 million.
The first number surprised me most. For each token that Claude writes, it reads approximately 150. Most of that is the same context, read again from the cache on every call. The cache is the reason this is affordable at all.
A quarter of my tokens went to agents I never saw
Sub-agents work in the background. You see their summary, not their calls. But each one has its own transcript, in a subagents/ folder inside the session.
My first ingest found only 103 of 250 transcripts, because I did not look in those folders. Later I found a second problem: the sub-agent calls were in the database, but credited to the parent session. After the fix, each call belongs to its own transcript.
In August, sub-agents were 49% of my input tokens. Now they are 23.9%. My main sessions grew faster than my sub-agent use. Without the tool I would not know either number.
/stats counts two times
One API call can write several records to the transcript, one for each block of the answer. /stats adds the tokens of all of them. The tool counts each call once, and it also reproduces the /stats arithmetic, so I can compare. For my last 30 days:
- 468 M tracked tokens vs 956 M with the
/statsarithmetic, - an estimated API cost of $194.24 vs $407.98.
Same sessions, two times the number.
Why local and offline
Transcripts contain everything: my prompts, file contents, project names. I did not want to upload them to a SaaS dashboard to count tokens. The tool reads the files where they are, the database runs in a container, and Grafana is bound to localhost. The only thing that comes from the internet is the price list, and that is a file in the repository.
How to try it
You need Docker and make. Five commands: make env, make build, make up, make ingest, make dashboard. Grafana opens at localhost:3000 with the dashboards already there. The first build compiles a PostgreSQL extension and takes 10–20 minutes. After that, it is fast.
What I learned
- Count the right unit. A session is not a file. A session has many transcripts, and sub-agents are real API calls.
- Check the totals against the source. My integrity check passed in August and failed in October. Run it again after each change.
- One total hides the story. The cache share, the sub-agent share and the long sessions only show up per call.
- Claude Code built most of it. I used an agent pipeline with a code-reviewer agent, and the reviewer found real defects on almost every run.
More information
The project page describes the full tool: Claude Code Session Analytics. Other deep dives will follow.
As a reference, if you use many agents you can also read Controlling one agent is easy.