In my last post, I loaded three months of Claude Code transcripts into PostgreSQL. A database is good for questions you already have. Dashboards are good for the questions you did not think of. With the tool, four Grafana dashboards are built to answer questions regarding Claude Code token spending and session types.
Why Grafana
The data is already in PostgreSQL, and Grafana reads PostgreSQL directly. It runs in a container next to the database, it has time ranges and filters built in, and its dashboards are JSON files that I can keep in the repository. make dashboard starts it, with all four dashboards already loaded.
The dashboards
1. Where do my tokens go?
The Usage overview is the main dashboard, where one can find general stats and how the usage evolves over time.
The top row has the totals: tokens, sessions, API calls, cache-read %, durations and two cost estimates. Below are tokens and calls over time, cache efficiency, a session explorer and panels per agent type.
Two filters change it the most. Agent shows only the main agent or one sub-agent type. Small sessions hides sessions shorter than 30 seconds or with fewer than 5 calls, so a quick question does not change the averages.
This is the dashboard that showed me where a quarter of my tokens went: to sub-agents.
2. What happened in this session?
Session detail takes one session and shows it call by call: tokens per call, cache-read % per call, context growth and the time between calls. It also lists long gaps of 5 minutes or more.
This is where a cache miss shows up: on one call, the cache-read % drops and the cache-write tokens jump. The long-gaps table next to it often shows why.
3. Which session started which?
Working with an orchestrator and executors means that many sessions trigger sub-sessions. The handoff prompt carries an Origin session_id line.
Session lineage rebuilds those chains: parents, children, families, and children whose parent is missing.
For example, in my data there were 88 child sessions in the last 30 days days. The longest chain has 5 sessions.
4. What did the full job cost?
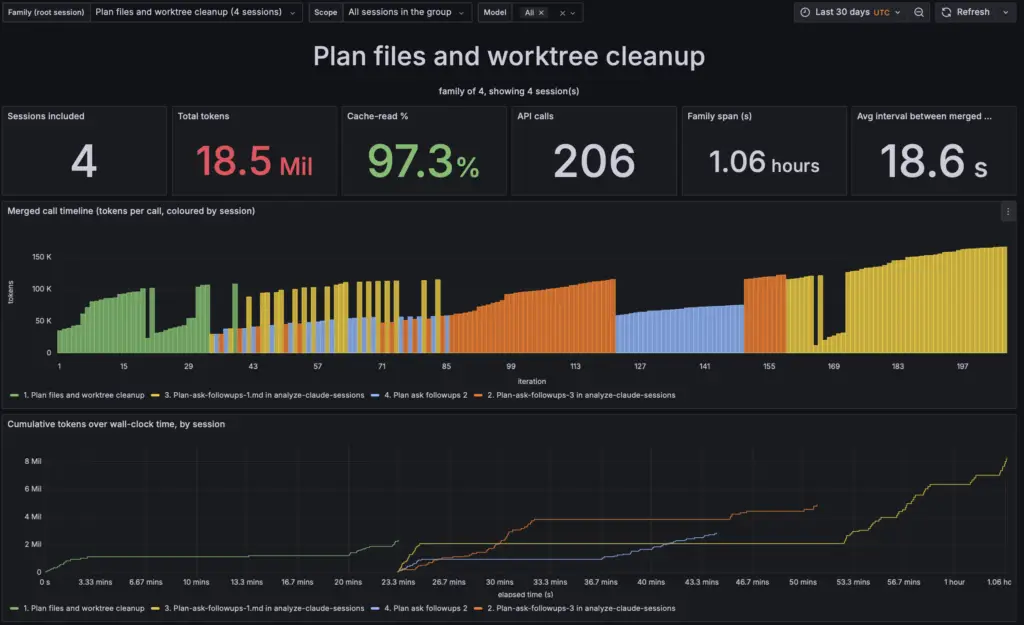
Multi-agent group sessions takes the root of a chain and merges all its sessions into one timeline. The tokens are coloured by session, with a cumulative line over wall-clock time.
A single session can not answer this question. For example, a feature with a plan session, some implementer sessions and a review session is one piece of work, and this dashboard shows it as one.
Dashboards as code
I do not click the dashboards together. Grafana loads the datasource and the four dashboard JSON files from the repository when it starts. A change to a panel is a change to a file, and it goes through a pull request.
What I learned
- One question per dashboard. When a dashboard tries to answer everything, it answers nothing. Be mindful of what you want to answer, and construct based on your questions.
- One view per panel. The SQL lives in the database, as views. The panels stay small, and views can be tested.
- Defaults matter. Hide small sessions by default, so a quick question does not distort the averages.
- Grafana variables are input. Treat them like user input: escape them, and give Grafana a read-only role.
More information
Each dashboard is described panel by panel in the deep dive Four Grafana dashboards.
The project page: Claude Code Session Analytics.